Track every deal.
Find what wins.
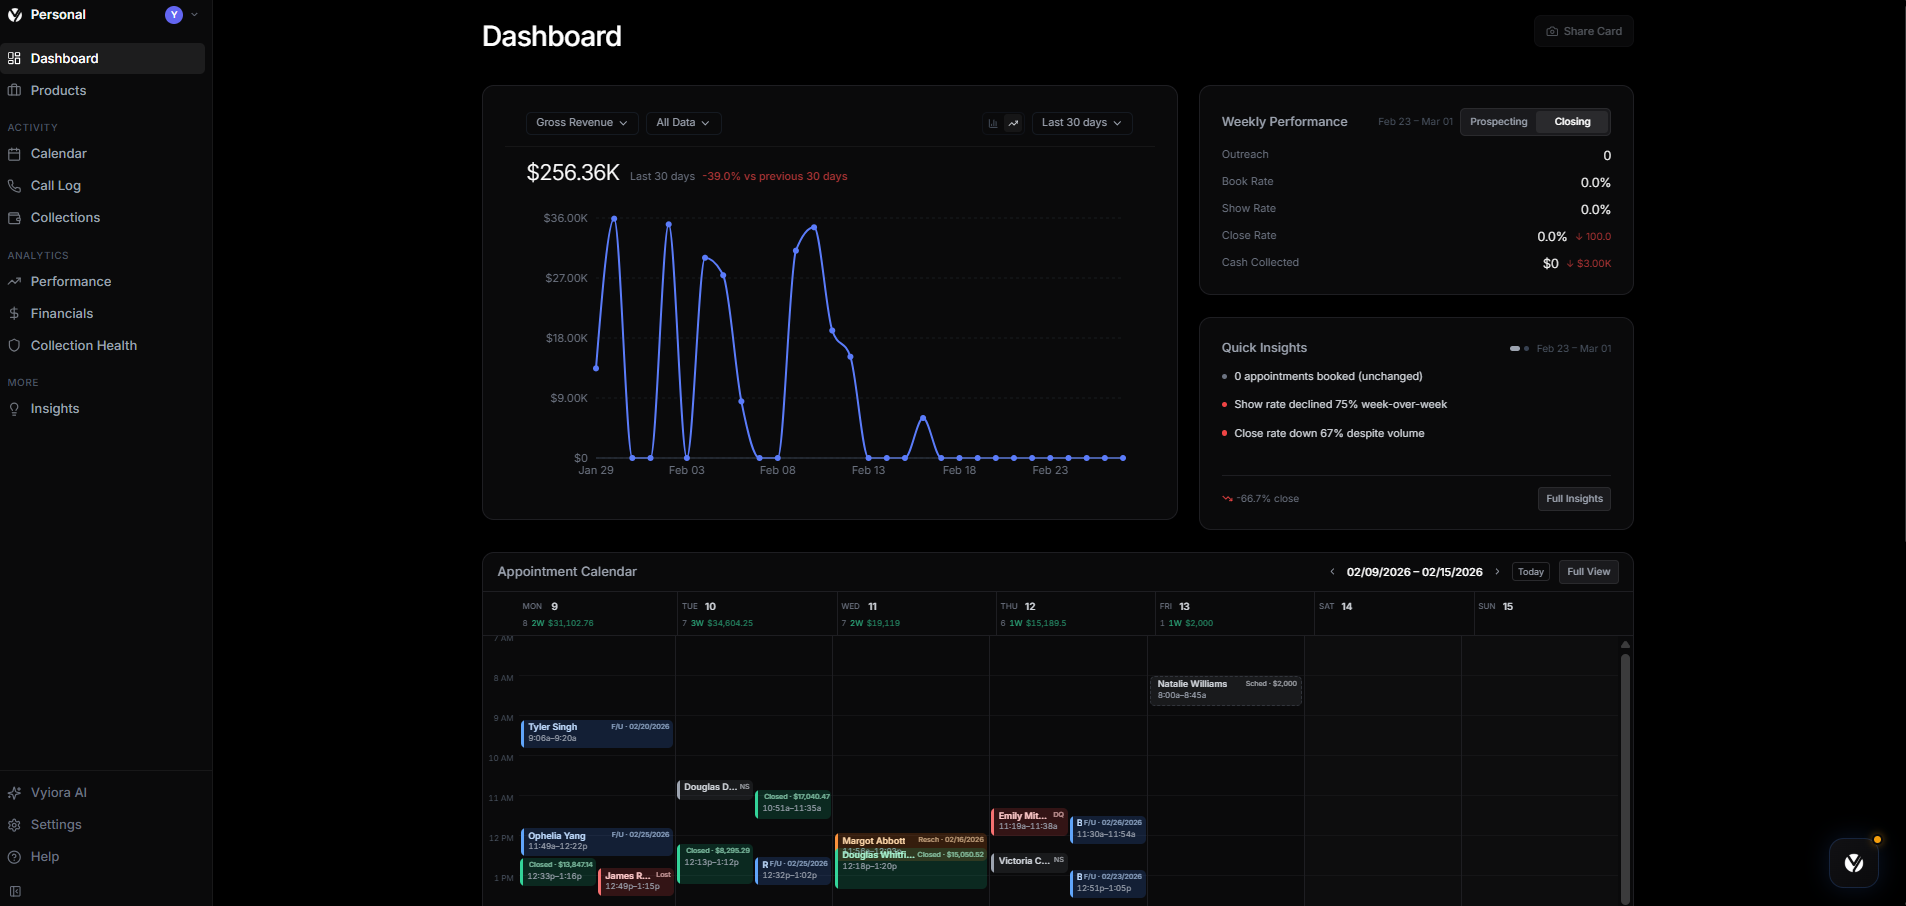
Built around real sales activity. Track deals from close to cash.
Interactive Tour
See your funnel come to life
The full workflow in 60 seconds
Best experienced on desktop
Activity ≠ performance
Volume masks inefficiency
Clarity requires structure
The plateau
Every rep hits a wall
$10K months turn into $15K
More calls stop moving the needle
The grind stops working
Clarity breaks through
The reps who scale past plateaus aren't working harder — they're analyzing what's leaking and tightening their funnel.
The shift
Not a CRM
An analytics layer, not another system.
Bloated tools
Lightweight structure
Unclear deal outcomes
Payment flow visibility
Lagging reports
Live performance indicators
Scattered Spreadsheets
One transparent record
You don't need another CRM. You need to see what's actually happening.
The system
Three steps. One source of truth.
Capture outcomes
Measure performance in real time
Understand what’s actually working
Identify what's driving revenue —
Product-level
Which products actually convert
Where deals stall
Revenue per action
Rep-level
Who closes efficiently
Volume vs outcomes
Cash collected vs owed
Built for reps running multiple products.
Designed around real payment structures.
Focused on what closes — not what sits in the pipeline.
Enterprise
For organizations
SSO, granular role-based access, dedicated support, and custom implementations.